
Showing posts from category data.
-
Updates to African Conflict Database Give Researchers Access to Comprehensive, Near Real-Time Information
›Despite the end of Cold War-era civil wars, political violence rates in Africa remain remarkably high. However, this broad statement hides an important qualification: the types of violence that have persisted in recent years have changed significantly, shifting from rebel and government activity towards violence against civilians, riots, protests, and battles by armed groups other than rebels.
The only way researchers can track this activity is through political violence data disaggregated by type, location, and time. The Armed Conflict Location and Event Dataset (ACLED) project aims to provide that service. We recently released updated information on political violence across Africa from January 1997 to December 2011 (see above for a hotspot map and timeline of violence over this period).
New to the ACLED project are real time data and trend reports on monthly conflict patterns throughout the continent. It is now perhaps the comprehensive and representative depiction of political violence as it occurs throughout Africa.
The data captures an array of actions including battles, looting, rioting, protesting, violence against civilians, and non-violent activity (such as arrests, recruitment drives, troop movements) by a variety of actors such as governments, rebels, militias, rioters and protestors.
Each event is geo-referenced by location and time-stamped by day. In our recently released version, we also included fatalities by event; distinguished conflict groups by their type (government, rebel, political militia, communal militia, rioters, protesters, civilians etc.); and specified the type of interaction between actors (e.g. government-rebel battle; rebel-civilian attack). These changes make ACLED data flexible for multiple uses.
Several new findings on conflict patterns are found using ACLED data:- Violence against civilians accounts for approximately half of all conflict events.
- Generally, where they occur, civil wars intensely affect 19 percent of a state’s territory, yet rebel actions have drastically decreased since 2005.
- Militia activity has significantly increased since 2005 and is especially high during election periods in new democracies.
- Communal violence patterns are more widespread but affect fewer people than civil war violence.
- Civil war patterns are not strongly affected by climate changes, but communal conflict decreases during periods of local scarcity and increases on the cusp of rainy seasons.
- Political violence increases in the period from peace talk announcements to negotiations. This violence is directed towards overtaking territory and civilians are frequently the main victims.
Fine-grained data on the range of political violence in the developing world is important as it provides the opportunity to ask and potentially answer certain questions about a range of issues related to governance, economic development, and conflict dynamics themselves.
For example, ACLED data shows that violence is increasingly occurring in villages, towns, and cities across Africa. In other words, political violence may be “urbanizing.” This has important implications for how we understand the practice of politics, the geography of marginalization, and the role of trigger patterns in explaining conflict. But there are many competing theories that could explain this trend.
Using data that disaggregates by violence type allows us to probe deeper: If the environmental security framework is correct, political violence in towns may be a response to high in-migration from rural areas to cities. Violence therefore is due to competition between urban people and migrant populations.
An alternative explanation is that the poor conditions of African urban life, high rates of informal employment, and under-representation of urban communities in government might explain an increase in violence. In this case, violence is a populist response, in that civilians riot and protest in favor of government reform.
Finally, the advantages of densely populated urban areas – easier access to resources, recruits, infrastructure, and power – may attract more organized groups to contest these spaces. If this explanation were correct, we would expect higher rates of rebel activity against government forces in cities, with a clear drive to overtaking the capital.
We have not been able to address these questions before with credible and comprehensive data, but now we can. Indeed, such data is crucial for interrogating the climate-security debate.
For example, Clionadh recently co-authored an article in the Journal of Peace Research’s special issue on climate and conflict, which used ACLED data for East Africa. In that piece, she and her co-author argued that different conflict groups use their environment in accordance with their overall goals. While much of the conflict activity studied had an environmental signal, the climate signal was much weaker.
We hope that these studies and other work with disaggregated data spur more theories and explanations of conflict patterns in developing states, and that the breadth and form of the data allows for new directions within conflict research.
Clionadh Raleigh is an assistant professor in the Department of Geography at Trinity College, Dublin, external researcher at the Peace Research Institute Oslo (PRIO), and director of the ACLED project. Caitriona Dowd of Trinity College and Andrew Linke of the University of Colorado are senior researchers for ACLED.
Image Credit: ACLED. -
International Research Institute for Climate and Society
Ethiopia Provides Model for Improving Climate, Other Data Services in Africa
›The original version of this article appeared on the International Research Institute for Climate and Society (IRI).
In developed countries, we are accustomed to having access to long and detailed records on weather and climate conditions, demographics, disease incidence, and many other types of data. Decisionmakers use this information for a variety of societal benefits: they spot trends, fine-tune public health systems, and optimize crop yields, for example. Researchers use it to test hypotheses, make forecasts, and tweak projections from computer models. What’s more, much of these data are just a mouse click away, for anyone to access for free (see examples for climate and health).
Across much of Africa, however, it’s a different story. By most measures, Africa is the most “data poor” region in the world. Wars and revolutions, natural and manmade disasters, extreme poverty, and unmaintained infrastructure, have left massive gaps in socioeconomic and environmental data sets. Reliable records of temperature, rainfall, and other climate variables are scarce or nonexistent. If they do exist, they’re usually deemed as proprietary and users must pay to get access. This is not an inconsequential matter. Without readily available, reliable data, policy makers’ ability to make smart, well-informed decisions is hobbled.
The problem of data access persisted even in Ethiopia, regarded as having one of the better meteorological services on the continent. Thanks to the recent efforts of Tufa Dinku, a climate scientist at the International Research Institute for Climate and Society, the situation has improved considerably.
Continue reading on IRI.
Video Credit: Overview of Ethiopia Climate Maprooms, courtesy of IRI. -
Deborah Mesce, Behind the Numbers
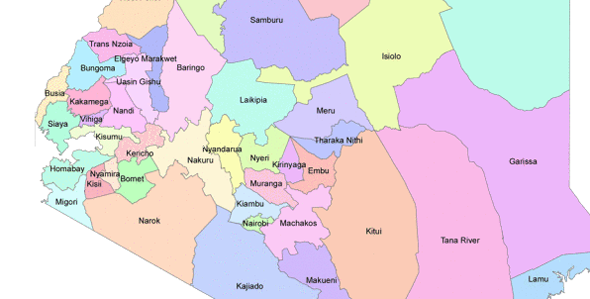
Kenya’s New Data Website Puts the Ball in Media’s Court
›The original version of this article, by Deborah Mesce, appeared on PRB’s Behind the Numbers blog.
The Kenya government took a bold step toward transparency a few weeks ago when it fired up its Open Data website and posted loads of data in a format that makes the information easily understood by the average person. The data sets include national census statistics as well as government spending, and the government promises more data to come. This is a boon for journalists willing to wade into the numbers to examine what’s going on in their country and hold their government accountable. I’m waiting now to see how they will use this new tool.
We always hear that information is power, but that works only if the information is used. Lots of information begins as numbers, statistics, and data sets, with lots of good stories tucked away in there to be found by the journalist willing to go the extra mile, examine the numbers, and do the math. In many developing countries, the information – numbers, statistics, data sets – isn’t easily accessible, if it is available at all. Governments keep a tight hold on it, or if it’s made available, the average person would be hard pressed to make heads or tails out of it.
Continue reading on Behind the Numbers.
Image Credit: Open Data. -
PRB’s Population Data Sheet 2011: The Demographic Divide
›August 9, 2011 // By Kellie Furr“Today, most population growth is concentrated in the world’s poorest countries – and within the poorest regions of those countries,” write the authors of the 2011 Population Data Sheet, an analysis tool published annually by the Population Reference Bureau (PRB). The population projections between poor and rich countries are “stark and very sad,” said Carl Haub Haub, senior demographer at PRB, at the July 28 web-based launch of the Data Sheet: “We call it the demographic divide. It shows the vast difference that has developed between the rich and poor countries of the world.”
The Population Data Sheet offers insight on global population trends using detailed statistical information along 18 demographic, population, health, and environment indicators for more than 200 countries and regions. The data sheet is based on the latest projections of the UN Population Division. Carl Haub and James Gribble of PRB discussed the long-term implications of the data sheet’s projections during web-based launch that included open questions.
Conflicting Trends
“Even though the world population growth rate has slowed from 2.1 percent per year in the late 1960s to 1.2 percent today, the size of the world’s population has continued to increase – from 5 billion in 1987, to 6 billion in 1999, and to 7 billion in 2011,” write the authors in PRB’s July Population Bulletin, “The World at 7 Billion.” To put those population totals into perspective, it took from the inception of human existence until the year 1800 – a total of approximately 50,000 years – to reach the first billion.
Fortunately, the recent (relative) decline in global growth rate has already curbed what could have been a considerable surge in the world’s population: “If the late 1960s population growth rate of 2.1 percent – the highest in history – had held steady, world population would have grown by 117 million annually, and today’s population would have been 8.6 billion,” said PRB President Wendy Baldwin in a press release. However, the world’s population still grows significantly at 77 million people annually, according to the UN, and we’re slated to reach 8 billion in just another 12 years. How can this dichotomy of large population totals in the face of lowered fertility be explained?
The Phases of Demographic Transition
“To understand global, we actually have to think local,” said PRB in their film short, “7 Billion and Counting,” released alongside the data sheet. Individual countries go through demographic transitions at different times, and the disparity in where countries are along in their progression varies greatly.
A demographic transition essentially hinges on two trends: the decline of birth and death rates over time. These trends do not necessarily change simultaneously however, resulting in most cases, first, a natural increase (when mortality rates decline but birth rates remain high) followed by a natural decrease in population (when birth rates also decline). Though the timing and magnitude of these trends differ from place to place, there are broad similarities across countries which have been conceptualized as phases by demographers, such as Carl Haub and James Gribble.Phase one is characterized by high birth rates and fluctuating death rates, found in countries such as Niger, Afghanistan, and Uganda; typically only death rates decline in this phase. Phase two, encompassing mostly lower-middle income countries such as Guatemala, Ghana, and Iraq, is marked by a continued decline in death rates but only slightly lower birth rates. The potential for large population growth exists in these countries, as they still possess a large youth population.
Countries in phase three have yet lower birth and death rates and overall total fertility rates close to the widely-accepted replacement level of 2.1 children per woman; these countries are home to approximately 38 percent of the world’s population and include India, Malaysia, and South Africa. Phase three countries often still possess a disproportionately large working age population as an echo of their previous growth, which allows them to take advantage of the “demographic dividend.”
Finally, phase four countries have the lowest birth and death rates, with some even seeing negative growth as total fertility rate falls at or below the natural replacement rate; countries in this phase include most of Europe and other developed countries, such as Japan and the United States (though relatively high levels of immigration keeps overall growth higher).
The data sheet shows that most developing countries still remain in the earlier phases of demographic transition, especially those in sub-Saharan Africa and the Middle East. Relatively recent public health improvements in these countries have decreased death rates at a rapid rate, and though total fertility rates (TFR) have declined as well, they have not kept the same pace: “This lag between the drop in death rates and the drop in birth rates produced unprecedented levels of population growth,” wrote Haub and Gribble in the Population Bulletin.
A Tale of Two Worlds
The data sheet authors observe that poverty is strongly associated with countries which are stalled in their progression through the demographic transition:Poverty has emerged as a serious global issue, particularly because the most rapid population growth is occurring in the world’s poorest countries and, within many countries, in the poorest states and provinces…Relatively high population growth rates make it more difficult to lift large numbers of people out of poverty.
In her primer video on demographic security for ECSP, demographer Elizabeth Leahy Madsen said, “we are in an era of unprecedented demographic divergence,” and characterized the phenomenon of population trends moving simultaneously in different directions as “rapid” and “unprecedented.”
Haub used Italy and the Democratic Republic of Congo (DRC) as an example to illustrate the divide. Although both countries currently sit at around 60 million people each, Italy is only projected to grow by 2 million through 2050, while the DRC is projected to reach a staggering 149 million people. Italy has a gross national income per capita of about $35,000, whereas DRC has only $180 per capita, according to the World Bank.
This observation has been corroborated by other demographers: “In 1950, 68 percent of the world’s population resided in developing regions. Today that’s up to 82 percent. But in the year 2050, it’s projected to be 86 percent,” said demographer David Bloom on NPR’s global health blog, Shots.
Demography ≠ Destiny
A poor country is not necessarily tethered to its projections, which are based on assumptions, said the authors, “but when, how, and whether [the demographic transition] actually happens cannot be known.”
Low development indicators do not always dictate that a country will lag in a demographic transition. “Government commitment to a policy to lower [birth rates] has succeeded quite well in countries with a low level of development,” said Haub in a 2008 PRB discussion on the demographic divide. Bangladesh and Iran are two examples of countries that significantly affected their demographic trajectories in the 20th century with targeted programs.
Proactivity certainly plays a role, as the PRB “7 Billion and Counting” video puts it (see above): “Understanding how and why the world’s population is growing will help nations better plan for the future…and for future generations.”
Sources: NPR, Population Reference Bureau, UN-DESA, UNICEF, World Bank.
Video and Image Credit: “7 Billion and Counting,” courtesy of PRB’s Youtube channel, and stages of demographic transition courtesy of PRB’s 2011 Population Data Sheet. -
Google Data Maps Development Indicators
›If you have not had the (purely wonky) pleasure of playing with Google’s Public Data Explorer, do yourself a favor and direct your browser there now.
Born from Hans Rosling’s Gapminder, Google’s data explorer currently allows the user to choose from 24 different data sets, including information from the World Bank, U.S. Census Bureau, Eurostat, and Energy Information Agency. Users can then customize the dataset’s variables, save their work, and even embed the resulting chart, “unveiling the beauty of statistics for a fact-based world view,” as the Gapminder site puts it.
The example dataset above uses development indicators from the World Bank to show areas of the world where high fertility rate and heavy reliance on subsistence agriculture have persisted over time. It’s worth noting that many of the countries in the upper right of the graph are also where we find persistent conflict, and, if one accepts the predictions that Africa will see some of the most profound effects of climate change, they also face real risk of continuing instability as declining crop yields threaten livelihoods and population growth continues. -
Interactive U.S. Map Shows Population, Energy, and Climate Data by State
›A new interactive map, developed by the Center for Environment and Population (CEP) and Clean Air-Cool Planet (CACP), lists state-level data on population, energy consumption, CO2 emissions, and vehicle-miles traveled. Accompanying the U.S. Population, Energy, & Climate Change report, the map depicts the sub-national, local level analysis necessary to help policymakers focus on the areas with the potential for the greatest gains.
Highlights:- New York has the “lowest state per-capita energy consumption, CO2 emissions, electricity consumption, and vehicle miles traveled,” and “it’s the only U.S. city where over half (about 75 percent) of the households don’t own a car.”
- Idaho “ranks fifth in growing population,” but “state per-capita CO2 emissions and electricity consumption are among the lowest in nation.” Most improved of all U.S. states in energy efficiency, Idaho “ranks fifth in renewable energy production and consumption per-capita.”
- Louisiana “ranked tenth in renewable energy production and consumption per-capita,” but still ranked “among [the] top ten states in energy consumption and CO2 emissions per-capita.” The state has a shrinking population and “is particularly vulnerable to sea level rise and severe coastal weather events.”
-
Columbia University’s Marc Levy on Mapping Population and Geographic Data
›September 24, 2009 // By Brian KleinAn interactive tool from Columbia University, the Gridded Population of the World (GPW) database, makes it easy to combine population and geographic data, explains Marc Levy, director of CIESIN at Columbia, in an interview with ECSP Director Geoff Dabelko.
“If you want to ask questions about how people are located with respect to drought hazards, for example, you can take your map of the location of droughts, overlay it with our map of population, and then you can get a sense of how many people are located in these drought zones,” Levy says. The user can do the same thing with infectious disease risk, vulnerability to sea-level rise, and other indicators.
GPW’s data is available to the public as:- A gallery of maps created by CIESIN;
- Raw data that can be downloaded in GIS format;
- An open web-mapping service that can be linked to Google Earth;
- TerraViva!, a program for user-generated maps.
-
Hans Rosling Animates DHS Data, Moves Debate
›June 1, 2009 // By Brian Klein“Statistics should be the intellectual sidewalks of a society, and people should be able to build businesses and operate on the side of them,” said Gapminder Foundation Director Hans Rosling at a discussion hosted by the Wilson Center’s Environmental Change and Security Program on May 26, 2009. In his spirited and often humorous remarks, Rosling praised the 25-year-old Demographic and Health Surveys (DHS) program, which is funded by the U.S. Agency for International Development (USAID) and implemented by Macro International, Inc., as “public-private partnership at its best.” The DHS program works with countries’ health ministries to collect data on family planning, child and maternal health, disease prevalence, and other health indicators, and makes the data freely available for public use.
The Beauty Behind the Data
Rosling uses Gapminder’s signature “moving bubble” Trendalyzer software—which Google purchased and made available as “Motion Chart”—to graphically demonstrate global health, economic, and environmental trends. Gapminder uses data from several sources, including DHS surveys, to generate its illuminating displays.
“Sweden, during the last hundred years, didn’t achieve [the] Millennium Development Goal rate” for yearly reductions in child mortality, Rosling explained. “We are putting goals for Tanzania, Bangladesh that [were] never…achieved by any country in West Europe or North America.” The remarkable thing, said Rosling, is that many low-income countries are achieving or even surpassing these demanding targets.
Free Access, Unified Formatting Are Top Priorities
Rosling stressed that access to data must be free, and admonished the World Bank, the Organisation for Economic Co-operation and Development (OECD), and others who charge for their statistics. “They say, ‘No, we can’t give the data to the people because they will make wrong comparisons, and they will make wrong conclusions,’” Rosling continued, “and I say ‘Yes, we call it freedom.’”
Rosling cautioned against “database-hugging disorder,” or statisticians’ tendency to guard their data because of concerns about budgets or misinterpretation. A better approach, he insisted, is to embrace innovations like the Creative Commons license, which encourages sharing information by offering a range of easy-to-understand legal protections and freedoms for creative works, data, and information.
In addition, “we don’t have a unified format for data,” Rosling said, and “that’s why the transaction costs are so enormously high, and that’s why those who put data together in unified format charge for it.” He cited YouTube as an excellent medium for broadening public distribution of data. To the audience’s delight, a live Google search for “sex, money, and health” returned a YouTube clip of one of his own presentations as its top hit.
Improving Lives With Data
“The worst environmental problem today is that two million children die of diarrhea [each year], and that billions of people drink their neighbors’ lukewarm feces,” said Rosling, and yet “water and sanitation data is very, very weak.” Collecting information from remote areas—often the most impoverished—is difficult. Measuring access to potable water is complicated because it requires community-based calculations, which do not fit into DHS’ household-centric methodology.
Rosling called upon young adults to work to “eradicate unnecessary disease and poverty in the world.” He also advocated improved post-graduate training in statistics, particularly in low-income countries.
Better statistical data will foment more effective solutions to development challenges—provided there are ambassadors like Rosling willing and able to unveil the beauty behind the numbers.
Photo: Hans Rosling. Courtesy of Dave Hawxhurst and the Wilson Center.


 “Statistics should be the intellectual sidewalks of a society, and people should be able to build businesses and operate on the side of them,” said