Showing posts from category Asia.
-
Twin Challenges: Population and Climate Change in 2050
›

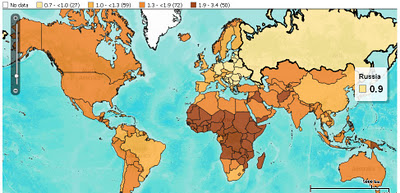
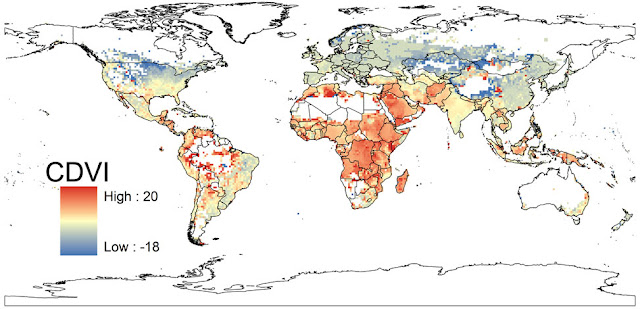
 With global population reaching 7 billion, a lot of attention has been paid to the question of how to sustainably support so many people, much less the 9 billion expected by 2050, or the 10 billion possible by 2100. Add in the environmental variability projected from climate change and the outlook for supporting bigger and bigger populations gets even more problematic. Two new maps – one by the Population Reference Bureau (PRB), the other by McGill University PhD candidate Jason Samson – show how the world might change over the next 40 years in the face of these twin challenges.
Nine Billion in 2050
PRB’s map, built using their DataFinder tool, shows the world in 2050 in terms individual country growth rates between now and then. Japan, Russia, and countries in Eastern Europe are set to grow more slowly than anywhere else, and some of that group will actually shrink by 10 to 20 percent of their current size. Western, Central, and Eastern Africa will be home to the highest increases. Niger’s 2050 population is expected to be 340 percent its 2011 size – the largest growth of any country.
The map is based on country-level data pulled from a number of sources: the UN Population Division’s latest “World Population Prospects,” the UN Statistics Division’s “Demographic Yearbook 2008,” the U.S. Census Bureau’s International Database, and PRB’s own estimates. It’s unclear what numbers come from which sources, though it is clear that PRB’s 2050 estimates span the UN’s range of medium, high, and constant-fertility variants. In spite of these variations, none of PRB’s estimates come anywhere near the UN Population Division’s low variant estimates.
PRB’s map, echoing its 2011 World Population Data Sheet, shows a world where sub-Saharan Africa will bear the brunt of population growth. The average country in Africa in 2050 is projected to be slightly more than twice its 2011 size; the average European country is expected to barely break even. Africa is home to more countries whose populations are estimated to least double (34) or triple (4) than any other continent. Europe, meanwhile, is home to more countries whose populations will stagnate (8), or even shrink (19), than anywhere else. Interestingly, the Caribbean is a close second in terms of countries whose populations are projected to stay the same (seven to Europe’s eight), and Asia is second to Europe in terms of countries whose populations are projected to shrink (Georgia, Japan, Armenia, South Korea, and Taiwan).
More People, More Climate Change, More Vulnerability
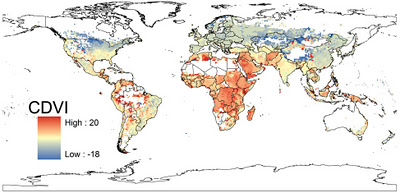
Samson’s map takes on the same time period but projects where people will be most vulnerable to the effects of climate change. Since his map takes into account population growth (measuring where people are most vulnerable, remember), unsurprisingly, Africa, the Middle East, Southeast Asia, and central South America are covered in bright red dots, indicating high vulnerability. Conversely, North America, Europe, and much of Central Asia are in shades of blue.
Samson built his index using four environmental predictors – annual mean temperature, mean temperature diurnal range, total annual precipitation, and precipitation seasonality – taken from WorldClim’s 2050 forecasts, and 2005 sub-national population data from Columbia’s Center for International Earth Science Information Network. In spite of the sub-national population data, Samson makes a point to justify his use of supranational climate data in order to best reflect “the scale at which climate conditions vary.” He writes that localized issues like urbanization and coastal flooding “are probably best investigated with targeted regional models rather than by attempting to modify global models to include all factors of potential regional importance.”
Samson’s research shows that, generally, people living in places that are already hot will be more vulnerable to climate change over time, while people in more temperate climates will feel a negligible impact. Though he projects the largest real temperature changes will happen in temperate climates like North America and Europe, the comparatively smaller changes in Africa, the Middle East, Southeast Asia, and central South America are expected to have a greater impact because those regions are already very hot, their natural resources are stressed, and they are expected to bear the brunt of population growth over the next few decades.
These findings reflect a disparity between those responsible for climate change and those bearing the brunt of it, which, although not surprising, “has important implications for climate adaptation and mitigation policies,” said Sampson, discussing the map in a McGill press release.
Sub-National Data “Present a Very Different Picture”
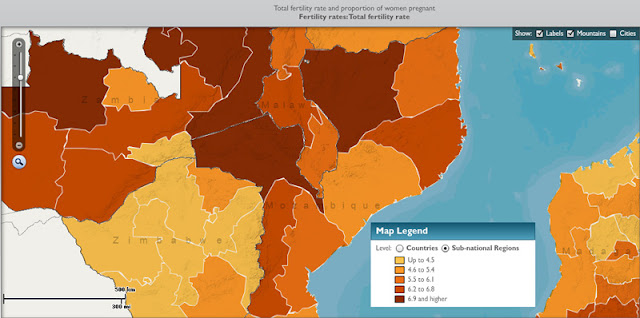
Though they offer a useful approximate glimpse at what the world might look at in 2050, both of these maps fall prey to over-aggregation. By looking at national rather than sub-national data, we miss how nuanced population growth rates can be within a country. Stimson Center Demographer-in-Residence Richard Cincotta wrote in a recent New Security Beat post that “national level comparisons of total fertility rates tend to communicate the false impression of a world with demographically homogeneous states.” Sub-national data, including differences between urban and rural areas and minority-majority fertility rates, “present a very different picture.”
And that difference matters. When it comes to looking at how population interacts with other issues, like the environment, poverty, and conflict, the importance of a sub-national approach becomes evident. In its 2011 data sheet, PRB writes that “poverty has emerged as a serious global issue, particularly because the most rapid population growth is occurring in the world’s poorest countries and, within many countries, in the poorest states and provinces.”
Edward Carr, an assistant geography professor at the University of South Carolina currently serving as a AAAS science fellow with USAID, argues that national-level data obscures our ability to understand food insecurity as well. The factors that drive insecurity “tend to be determined locally,” writes Carr in a post on his blog, and “you cannot aggregate [those factors] at the national level and get a meaningful understanding of food insecurity – and certainly not actionable information.”
The same is true when it comes to climate vulnerability. In a report from The Robert S. Strauss Center’s Climate Change and African Political Stability Program, authors Joshua Busby, Todd Smith, and Kaiba White write that “research announcing that ‘Africa is vulnerable to climate change,’ or even ‘Ethiopia is vulnerable,’ without explaining which parts of Ethiopia are particularly vulnerable and why, is of limited value to the international policy community.”
“It is of even less use to Africans themselves, in helping them prioritize scarce resources,” add Busby et al.
Understanding the joint problems of climate change and population growth on a global level helps frame the challenges facing the world as it moves toward 8, 9, and possibly 10 billion. But knowing the ins and outs of how these issues interact on a local level will be a necessary step before policymakers and others can hope to craft meaningful responses that minimize our vulnerability to these challenges over the coming decades.
Sources: Center for International Earth Science Information Network at Columbia University, Climate Change and African Political Stability Program at the Robert S. Strauss Center, McGill University, Population Reference Bureau, UN Population Division, UN Statistics Division, U.S. Census Bureau, University of South Carolina, WorldClim.
Image Credit: “2050 Population As a Multiple of 2011,” courtesy of PRB; CDVI map used with permission, courtesy of McGill University; Sub-national total fertility rates in Southern Africa, courtesy of MEASURE DHS, arranged by Schuyler Null. -
Michael Kugelman for Seminar
Safeguarding South Asia’s Water Security
›November 4, 2011 // By Wilson Center StaffThe original version of this article, by Michael Kugelman, appeared in the public policy journal Seminar.
In today’s era of globalization, the line between critic and hypocrite is increasingly becoming blurred. Single out a problem in a region or country other than one’s own, and risk triggering an immediate, yet understandable, response: Why criticize the problem here, when you face the same one back home?
Such a response is particularly justified in the context of water insecurity, a dilemma that afflicts scores of countries, including the author’s United States. In the parched American West, New Mexico has only 10 years-worth of drinking water remaining, while Arizona already imports every drop. Less arid areas of the country are increasingly water-stressed as well. Rivers in South Carolina and Massachusetts, lakes in Florida and Georgia, and even the mighty Lake Superior (the world’s largest fresh-water lake) are all running dry. According to the U.S. Environmental Protection Agency, if American water consumption habits continue unchecked, as many as 36 states will face water shortages within the next few years. Also notable is the fact that America’s waterways are choked with pollution, and that nearly twenty million Americans may fall ill each year from contaminated water. Not to mention that more than thirty U.S. states are fighting with their neighbors over water.
Such a narrative is a familiar one, because it also applies to South Asia. However, in South Asia, the narrative is considerably more urgent. The region houses a quarter of the world’s population, yet contains less than five percent of its annual renewable water resources. With the exception of Bhutan and Nepal, South Asia’s per capita water availability falls below the world average. Annual water availability has plummeted by nearly 70 percent since 1950, and from around 21,000 cubic meters in the 1960s to approximately 8,000 in 2005. If such patterns continue, the region could face “widespread water scarcity” (that is, per capita water availability under 1,000 cubic meters) by 2025. Furthermore, the United Nations, based on a variety of measures – including ecological insecurity, water management problems and resource stress – characterizes two key water basins of South Asia (the Helmand and Indus) as “highly vulnerable.”
These findings are not surprising, given that the region suffers from many drivers of water insecurity: high population growth, vulnerability to climate change, arid weather, agriculture dependent economies, and political tensions. This is not to say that South Asia is devoid of water security stabilizers; indeed, its various trans-national arrangements, to differing degrees, help the region manage its water constraints and tensions. This paper argues that such arrangements are vital, yet also incapable of safeguarding regional water security on their own. It asserts that more attention to demand-side water management within individual countries is as crucial for South Asian water security as are trans-national water mechanisms.
Continue reading on Seminar.
Michael Kugelman is a program associate for the Asia Program at the Woodrow Wilson Center.
Sources: The American Prospect, Jaitly (2009), The New York Times, UNEP, UN Population Division, Washington Post.
Video Credit: “Groundwater depletion in India revealed by GRACE,” courtesy of flickr user NASA Goddard Photo and Video. For more on the visualization, see the story on NASA’s Looking at Earth. -
How Did We Arrive at 7 Billion – and Where Do We Go From Here? [Part One]
›October 26, 2011 // By Elizabeth Leahy MadsenThe United Nations Population Division has estimated world population will reach seven billion on Monday. Which changes in demographic trends led us to this milestone? What do the past and present tell us about how human numbers will change in the future?
The “Day of Seven Billion” was announced this spring following the release of the latest revision of UN population projections. Although the seven billionth person will not be precisely identified, this estimate is based on careful demographic modeling. Every two years, the UN revises its projections to incorporate the latest trend data and modify its assumptions, as seemingly small changes can make a huge difference demographically.The UN estimates that the seven billionth person alive today will be born on October 31. Demographer Elizabeth Leahy Madsen explains how we got to that number, its significance, and where our demographic path might take us from here. Read part two here.
The United Nations Population Division has estimated world population will reach seven billion on Monday. Which changes in demographic trends led us to this milestone? What do the past and present tell us about how human numbers will change in the future?
The “Day of Seven Billion” was announced this spring following the release of the latest revision of UN population projections. Although the seven billionth person will not be precisely identified, this estimate is based on careful demographic modeling. Every two years, the UN revises its projections to incorporate the latest trend data and modify its assumptions, as seemingly small changes can make a huge difference demographically.
Demography Is Driven by Fertility and Population Momentum
Since world population reached three billion in 1959, the rate of growth has increased, peaked, and begun to slow. Each succeeding milestone was reached more quickly than the last: It took 15 years to reach four billion, 13 years to hit five billion, and only 11 years to get to six billion at the end of 1998. The interval leading to seven billion was slightly longer, at 13 years, as the global rate of population growth has slowed.
Although mortality and migration also affect population trends, the factor with the greatest influence by far is fertility – the average number of children born to each woman. The decline in the global fertility rate from an average of nearly 5 children per woman in the early 1960s to 2.5 children today has in turn slowed the pace of world population growth. However, demographic momentum from previous generations of high fertility can drive population growth for decades to come. Even if Nigeria reached replacement-level fertility today, its population would still grow by one-third by 2050 as the number of births continued to exceed the number of deaths.
Assumptions Matter
Population projections consider: 1) current data about fertility and 2) assumptions about the ways fertility will change in the future. These assumptions vary depending on the source, so how much of a difference do they make? As it turns out, quite a lot.
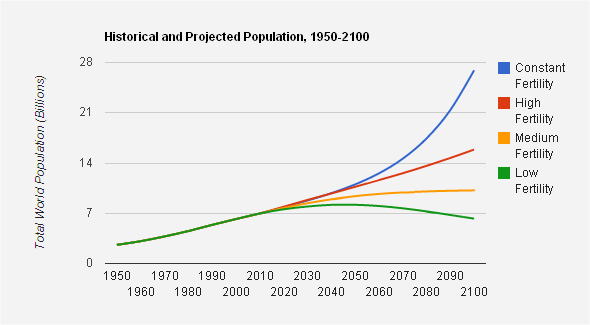
Projections of world population in 2050 range from 8.1 billion (if fertility rates fall to a global average of 1.7 children per woman) to 10.9 billion (if they remain unchanged). The gap of nearly three billion between those possibilities is greater than the combined populations of China and India today.
Estimates vary even more widely for the end of the century, with the UN projecting that by 2100 world population could total anywhere between 6 billion (if total fertility falls to an average of 1.55 children per woman) and 27 billion (if every country’s fertility rates remain constant at today’s levels).
While demographers parse the details of the projections, policymakers would like to know which of these scenarios is more likely. After all, the economic, environmental, and political consequences of a population of 8 or 11 billion two generations hence are not the same, and a world of 27 billion is difficult for anyone to fathom.
If we simply projected past trends into the future at a steady rate, the population estimates on the low end of the fertility spectrum seem more likely. The global fertility rate has fallen from 4.5 children per woman in the early 1970s to 2.5 today, a decline of 43 percent, so the 14 percent decline projected in the medium-fertility variant between now and 2050 seems reasonable at first glance, perhaps even conservative. The medium-fertility variant assumes that all countries’ fertility rates will begin moving towards replacement level, around 2.1 children per woman, regardless of whether they are currently above or below that number.
However, even a 14 percent decline in fertility assumes that areas where fertility rates remain stalled at high levels will soon begin rapid declines, paralleling the past experience of other regions. As Population Reference Bureau demographer Carl Haub writes, “the assumption that the developing world will necessarily follow the path of the industrialized world…is far from a sure bet.”
In the last 40 years, fertility rates in the Caribbean, northern and southern Africa, Latin America, and all of Asia declined by 50 percent or more. The pace of decline in sub-Saharan Africa, while still notable, was much slower, at 23 percent. In order to meet the UN medium-variant projections, the region’s fertility rate would need to fall by nearly 40 percent by mid-century.
Some of the largest, fastest-growing populations in the developing world would need to experience a major acceleration from recent trends. In Nigeria, fertility edged down by 15 percent between 1970 and 2010, but the medium variant projection depends on a decline of 37 percent over the next four decades; Ethiopia’s fertility rate will need to fall by half.
Gender Matters, Too
The great irony of fertility trends is that gender inequities play an important role at both ends of the scale. In countries with the highest fertility rates, women tend to have less education than men and less autonomy. Their fertility choices may be greatly affected by the preferences of their husbands or other family members. In Niger, which has the highest fertility rate in the world, married men would, on average, like three more children than married women. In Uganda, where women average more than six children each, 60 percent of men report that domestic violence is justified.
By contrast, in countries with the lowest fertility rates, women have achieved equal access to education and the labor market, with more autonomy about how to earn income and what to do with it. Yet cultural expectations that place the burden for child and elder care and housework almost entirely on women can make marriage an unappealing option. In Japan, which is among the 10 lowest fertility countries in the world, more women are choosing to stay single: The marriage rate has fallen by almost half since the 1970s. Japanese women who do marry are waiting until their late 20s and tend not to give birth until they are 30, both of which result in lower average family size.
Even at this end of the demographic spectrum, the assumptions embedded within population projections seem optimistic. Japan’s fertility rate was last above replacement level in the early 1970s; it has fallen steadily to 1.3 children per woman today. The UN projections assume that fertility will immediately reverse track and begin rising to over 1.8 children per woman in 2050, rebounding above two children per woman before the end of the century.
The stalled high fertility rates in much of sub-Saharan Africa and parts of the Middle East, together with unprecedented low fertility in Eastern Europe and parts of East Asia, indicate that we are currently in an era of remarkable demographic diversity, despite the UN’s projection of future convergence.
Continue reading part two here.
Elizabeth Leahy Madsen is a consultant on political demography for the Wilson Center’s Environmental Change and Security Program and former senior research associate at Population Action International.
Sources: Boling (2008), Haub (2011), Japan Statistics Bureau, Measure DHS, UN Population Division, UN Population Fund, Washington Post.
Image Credit: Chart data from UN Population Division, arranged by Elizabeth Leahy Madsen. -
Water: Asia’s New Battleground
›“Asia faces a daunting water crisis,” warns Brahma Chellaney, professor at the Center for Policy Research (New Delhi) and author of the new book, Water: Asia’s New Battleground. It is a crisis that imperils the region’s economic and political rise, and that deepens environmental risk in a part of the world marked by melting glaciers and densely populated coastal areas.
In his book, Chellaney, regarded as one of India’s most distinguished strategists, surveys the water landscape across Asia; examines the security implications of water-based territorial disputes; and offers policy recommendations to help prevent water conflict. On September 12, Chellaney spoke about Water at a Wilson Center event organized by the Asia Program and co-sponsored by the China Environment Forum and Environmental Change and Security Program. Steven Solomon, a journalist and author who last year published Water: The Epic Struggle for Wealth, Power, and Civilization, offered commentary.
According to Chellaney, Water “fills a void in the literature” by, for the first time, focusing on water issues across the entire continental region of Asia – an immense expanse that includes not only Northeast, Southeast, and South Asia, but also Central Asia and the Middle East. The book, he explained, defines Asia “as it looks on a map.”
The World’s Dam Center
What drives the water crisis in this vast region? One factor is population. Asia is the world’s largest and most populous continent but also the most water-deficient; its freshwater levels per capita are one-third those of Europe’s, and slightly less than Africa’s. Another is tied to economic development. Asia is the world’s fastest developing continent, yet its most rapidly developing nations, particularly India and China, are already afflicted by serious water challenges.
Rising income levels and attendant growth in consumption rates are additional drivers. Asians are consuming more resources, including meat, which requires prodigious amounts of water to produce. A fourth factor is intensive irrigation. Seventy percent of the world’s total irrigation originates in Asia, and 80 percent of the region’s “water withdrawals” are allocated to agriculture. (The latter figure is only 30 percent in Europe.) Such large-scale irrigation has enabled Asia to evolve from “a land of recurrent famine” to a major food exporter, yet it has also spawned ruinous agricultural conditions such as waterlogging and soil salinity.
Chellaney contended that Asia’s water ills can also be attributed to the “large-scale impoundment of water” by dams, barrages, and other storage-creating structures. Asia is the world’s “dam center,” he said, with China boasting half the world’s dams and now planning to construct “mega dams,” including one “higher than the Eiffel Tower.” Impounding water triggers riverwater depletion, which in turns promotes “the reckless use” of sub-surface groundwater resources, said Chellaney. With water tables plummeting, millions of groundwater pumps are depleting what used to be a pristine and plentiful resource.
“We Need Better Politics”
In a region rife with transboundary rivers yet devoid of mechanisms to promote transboundary water-sharing, Asia’s water troubles pose grave geopolitical risks.
According to Chellaney, “water wars” are already being waged across the region via non-military means, fostering mistrust and hampering efforts toward greater cooperation. He argued that in order to forestall water conflict, Asia must develop a set of norms on shared resources based on the 1997 UN Convention on the Non-Navigational Uses of International Watercourses – the only available instrument for international water management. Chellaney also called for the creation of “inclusive water institutions,” that emphasize transparency and dispute settlements, and for the adoption of “holistic planning” on central and provincial governmental levels that aim for better water efficiency.
Playing devil’s advocate, Solomon faulted Chellaney for according insufficient attention to Asia’s crisis of energy – a resource that, he pointed out, is “extraordinarily water-intensive.” He also countered Chellaney’s criticism of dams by observing that Asia desperately needs storage – a deficiency that makes the region highly vulnerable to drought. And he questioned whether China’s dam-building activities on the Brahmaputra River truly imperil lower riparian India’s water security, noting that only 15 percent of the river’s flows entering India are impacted by Chinese dams.
Ultimately, Chellaney said, alleviating Asia’s water crisis will also require improving the region’s poor political environment. While Asian economies are coming together, its politics are more divided. Transboundary water cooperation – and any treaty meant to undergird it – cannot be expected to last if co-riparians do not get along. “We need better politics,” he concluded.
Event ResourcesMichael Kugelman is a program associate with the Wilson Center’s Asia Program.
Photo Credit: David Hawxhurst/Wilson Center. -
Rich Thorsten on Water Sanitation, Population, and Urbanization in the Developing World
› “For the first time in human history, more than one half of the world’s population now lives in urban areas, and some of the largest and fastest growing population centers in the world – countries like India, China, parts of sub-Saharan Africa – are in areas where water resources are becoming more and more scarce,” said Water.org’s Rich Thorsten in a recent interview with ECSP.
Thorsten serves as director of international programs for Water.org, which partners with local communities, governments, and NGOs across Central America, South Asia, and Africa to bring improved water sanitation to at-need rural and urban populations. He emphasized that ensuring access to clean water has a number of positive spillover effects, ranging from improved prospects for economic development to greater social stability, since access to non-polluted water supplies removes one potential source of tension within and between communities.
Community Health
The greatest benefit of improved sanitation services, however, comes in the form of enhanced public health outcomes. “I would definitely say there is a strong correlation” between the two, Thorsten asserted. “Water and sanitation-related diseases are related to the deaths of at least 3.5 million people every year in the developing world – not to mention millions of hours and dollars that are lost to treating health problems and coping with health problems as a result of poor [water] access and hygiene practices.”
Thorsten said that community participation has been a key aspect of ensuring the sustainability of Water.org’s projects. To pave the way for continued gains in economic development and public health, he said they work alongside water users, engineers, and government officials in target communities to make those parties stakeholders in the infrastructure development process. Fostering a sense of community ownership of sanitation projects helps reduce the likelihood that infrastructure will fall into disrepair or disuse after the initial programming intervention has been conducted.
Given that improving water-sanitation access for the world’s poor is a key element of the UN Millennium Development Goals, Thorsten said he is pleased the subject seems to be attracting more attention within the policymaking and development communities. Despite the positive momentum, however, he acknowledged the fight to ensure clean-water access for the developing world will remain an uphill battle.
“When one considers that….about 2.6 billion people lack access to basic sanitation, that there’s more people in the world that have access to a cell phone than a pit latrine or a toilet, it’s still a very daunting task that will require a lot more investment, commitment, and attention in order to improve the situation for billions of people,” Thorsten said.
Sources: UN.
The “Pop Audio” series is also available as podcasts on iTunes. -
Karen Seto on the Environmental Impact of Expanding Cities [Part Two]
› “A lot of cities are trying to become green cities,” said Karen Seto in part two of an interview with ECSP about her recently published article, “A Meta-Analysis of Global Urban Land Expansion,” co-authored with Michail Fragkias, Burak Güneralp, and Michael K. Reilly. “I think one of the main policy implications of our study is that how a city urbanizes is critical, because one of the things we are finding is that urban land is growing faster than urban population, and in some cases it is growing much faster.”
Seto said that the cities with the best prospects for implementing green growth and expansion strategies “tend to focus on the low-hanging fruit,” such as planting trees or constructing buildings with green roofs. From the public’s perspective, these types of measures are relatively painless because they “don’t require changing people’s behavior.”
More challenging, said Seto, will be getting rapidly expanding cities to anchor future development around public-transit systems, especially given the changing lifestyle preferences of upwardly mobile urban populations across China and India, for whom private car ownership serves as an important status symbol.
Still, Seto said she is tentatively optimistic about city planners’ ability to grow cities in a sustainable fashion. “We’ve experienced this rapid growth of urban population and urban land areas, but we’re also seeing that over the next 20 years, according to the UN, we’re going to see even more people living in urban areas,” she said.
“We have this window of opportunity to really shape the way in which cities get developed, and I think that’s really one of the big messages of the study.”
Part one of Karen Seto’s interview is available here. The “Pop Audio” series is also available as podcasts on iTunes.
Sources: China Daily, USA Today. -
Karen Seto on the Environmental Impact of Expanding Cities [Part One]
› “When we think about the environmental impacts of rapid urbanization, we really need to unpack what we mean by ‘urbanization,’” said Karen Seto, an associate professor in Yale University’s School of Forestry and Environment Studies, in this interview with ECSP. “There is the demographic component, where more people are living in cities; there is economic urbanization, which is where livelihoods and economies are becoming more urban rather than rural; and then there is the land component – the conversion of land from agriculture and other ecosystems to become urban.”
Seto is the lead author of a new article, “A Meta-Analysis of Global Urban Land Expansion” (with Michail Fragkias, Burak Güneralp, and Michael K. Reilly), which uses satellite imagery to help document the physical expansion of urban areas in developed and developing nations between 1970 and 2000.
Over that period, the population of cities in the developing world boomed. In 1970, there were roughly the same number of city dwellers in developed nations as in developing nations. By the mid-1990s, however, urban residents of the developing world outnumbered their developed-world counterparts by a factor of two to one. Since then, the gap has continued to grow.
According to the report, urban growth sprawled to cover nearly 60,000 square kilometers of previously non-urban areas during the last three decades of the twentieth-century. One of their most interesting finds, said Seto, was that “urban expansion has been occurring in low-elevation coastal zones more than it has been elsewhere.”
“Essentially what that means is that cities are growing precisely in areas that are highly vulnerable to the impacts of climate change, like sea level rise and storm surges,” she said.
Demography and the Environment
Seto acknowledged that many of the today’s discussions surrounding urbanization focus on the negative impacts for the environment and human security – among them the “loss of agricultural land, conversion of forests, biodiversity loss, changes in hydrology, and climate effects.” Ultimately though, she said, urbanization and its attendant land-use changes shouldn’t be viewed through a black-or-white lens.
“Certainly we think about the oncoming demographic transition of something like three billion more people living in cities,” Seto said, but “that means there’s a lot of efficiency to be gained, whether it is in education, energy, sanitation, or health – urbanization allows for opportunities for really efficient use of resources.”
The real challenge to achieving environmentally sustainable urban development, said Seto, is thoughtful city planning: “How we configure ourselves has a big impact on the environment, so it is not the issue of just whether we are urbanizing – the form in which we urbanize [also] has a huge impact.”
Part two of Karen Seto’s interview is available here. The “Pop Audio” series is also available as podcasts on iTunes.
Sources: Population Reference Bureau, UNFPA. -
Redrawing the Map of the World’s International River Basins
›Understanding why conflict over water resources arises between nations begins with a solid understanding of the geography of international river basins. Where are the basins? How big are they? How many people live there? Who are the riparian nations, and what is the significance of each to the basin?


