-
A Tale of Two Transitions: Education, Urbanization, and the U.S. Presidential Election
November 23, 2020 By Richard Cincotta
Rather than delve into issue opinion polling, or assess presidential campaign strategies, political demographers assume that political change is the predictable product of a set of mutually reinforcing social, economic, and demographic transitions, which can be tracked using data. But is this true in a country like the United States that has been in the advanced stages of these development transitions for decades? If these transitions are as important as demographers believe, could their variation among the 50 states explain the outcome of the recent U.S. presidential election? If so, what could they tell us about America’s electoral future?
My attempt to answer these questions begins with a brief discussion of the CNN exit polling during the 2016 presidential election and ends with an analysis of the 2020 state results. Given what has already been said about the Democratic Party’s appeal among college-educated Americans and the Republican Party’s appeal among rural Americans, the basic conclusions are not surprising. What I find surprising is the ability of these individual party strengths, almost by themselves, to divide America’s states into a hard-to-change red and blue pattern.
Clues from Exit Polling
Exit polling suggests that, hypothetically, at least two global development transitions might influence political outcomes on the scale of a state electorate: the education transition (the shift from small to large proportions of highly educated residents); and the urban transition (the shift from a mostly rural to a mostly urban populace).
In these 2016 exit polls, more of the sample’s college graduates voted for the Democratic ticket of Hillary Clinton and Tim Kaine than for the victorious Republican ticket of Donald Trump and Mike Pence. However, their preference margin (52 percent to 42 percent) was thin and, due to high levels of support for Clinton/Kaine among non-white college graduates, its nationwide impact was uncertain.
In nearly all 50 states, Democratic voting majorities appear as blue urban pockets surrounded by majority-Republican rural areas.
Exit polling indicated that urban residents were considerably more likely to have voted for Clinton/Kaine than for Trump/Pence (60 percent to 34 percent). Post-election maps reinforce this hypothesis. In nearly all 50 states, Democratic voting majorities appear as blue urban pockets surrounded by majority-Republican rural areas.
The 2016 exit polls suggested at least two other development transitions, but they are not used in the model: the transition to an older society (the age-structural transition), suggested by voter preference by age; and the income transition, suggested by preference according to income. Despite exit polling suggesting that older voters preferred Trump/Pence, the median age of states did not appear to influence state election outcomes. Median household income by state does show a relationship to state voting outcomes. However, it was omitted because (a) it was more weakly related to voting outcomes than either educational attainment or urban proportion, and (b) the income transition closely parallels education and urbanization. Median household income is strongly correlated to the state’s proportion of college graduates (with a correlation coefficient, r, equal to 0.80) and moderately correlated to its urban proportion (r = 0.48).
The 2020 Presidential Election
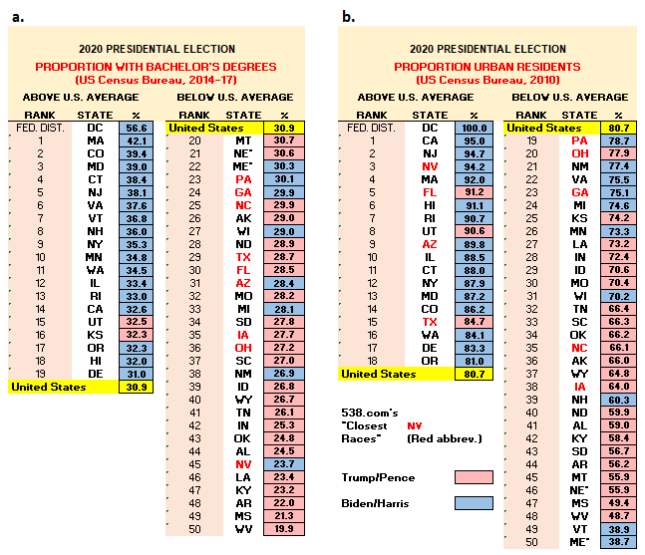
The first step to determining the influence of America’s education and urban transitions is to rank U.S. states by their population’s proportion of college graduates (Fig. 1a), and their proportion of urban residents (Fig. 1b). A quick glance at these lists shows that most of the states Biden/Harris won had above-average proportions of college graduates. Trump/Pence won most states with a lower-than-average urban proportion, particularly those with an urban share less than 73 percent. However, neither ranking flawlessly segregates Biden/Harris wins from Trump/Pence wins, nor are the two lists strongly correlated (r = 0.49).
Fig. 1. U.S. states ranked by their populations:
(a) proportion of college graduates (among adults ages 25 years and older); and
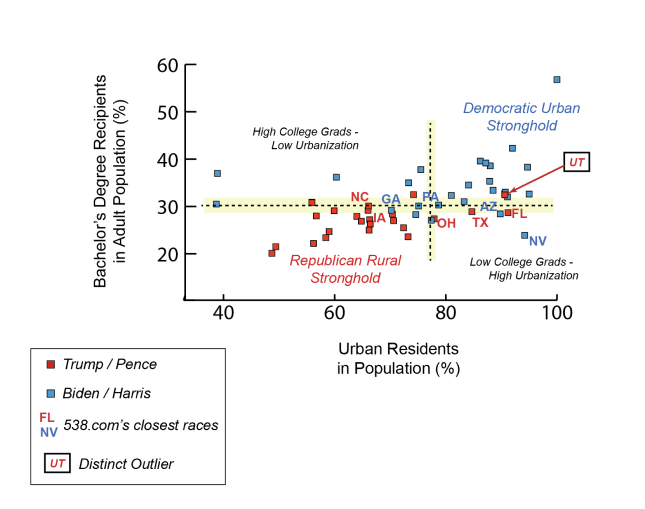
(b) proportion of urban residents.These transitions can be combined in two bar graphs, one for states with an above-average urban proportion, the other for states with a below-average urban proportion (Fig. 2). Together, they suggest that, in statewide elections:
- Democrats are most likely to win in states with an above-average proportion of urban residents (Fig. 2). Democrats have a veritable lock on states with both very high urban and very high college-grad proportions.
- Republicans are most likely to win in states with a below-average proportion of urban residents (Fig. 2). Republicans have a veritable lock on states with both very low urban and very low college-grad proportions.
- The closest races (in nine states, according to 538.com polling), often referred to as battleground states, are graphically clustered between these two locked-up regions—among states with an above-average urban proportion and low to moderate proportions of college graduates (NV, TX, FL, AZ); and among states with a below-average urban proportion and moderate proportions of college-educated residents (NC, IA, OH, GA, PA). Two midwestern states (MI, WI) won by Trump/Pence in 2016, then won by Biden/Harris in 2020, also fall within the latter group.
Beyond these simple observations, one can infer a few speculative conclusions from long-term data. Recent shifts from red to blue, or red to battleground, appear to be associated with growth among the proportions of urban residents and college graduates, usually in regions of the state that are urbanizing and accumulating college graduates (including CO, VA, GA, NC). Political analysts generally credit shifts from blue to red, or blue to battleground, to Republican ideological re-alignment: away from the traditional positions of American conservatism, such as fiscal conservatism, free trade, and international engagement; in favor of social conservatism, industrial protectionism, and more restrictive borders. Republican re-alignment has deeply resonated with working-class voters, forging inroads for the party across the Rust Belt—a formerly heavily industrialized region (including parts of IN, WV, OH, PA, MI, WI, MN, IL, and NY) that has suffered economically.
Party preferences of minority ethnic and religious groups may be the most consequential omission of this two-transition model. While acknowledged to influence each candidate’s statewide vote totals, minority preferences appear to tip electoral outcomes in only a handful of states. In the most distinct outlier, Utah, the country’s Mormon minority is in the majority (according to the Pew Research Center, 55 percent), and maintains its strong preference for Republican presidential candidates.
Fig. 2. Presidential election results, showing each state’s proportion of college graduates (vertical axis) and proportion of urban residents (horizontal axis).
Red, Blue, and Beyond
The two-transition model offers a relatively simple demographic way to understand America’s entrenched pattern of red and blue states, and arguably, to imagine the emergence of new battleground states in far-off presidential elections. Yet, even such gradual shifts assume—no doubt, unrealistically—rigid party positions, a stable political playing field, and the unobstructed forward movement of both the education and urban transitions.
U.S. presidential elections—when viewed through the lens of the two-transition model— seem destined to remain close and contentious for at least another decade.
A trend toward “bluishness” is by no means a fait accompli. U.S. higher education’s ongoing crisis of cost threatens both the educational transition’s pace of progress, and its distribution. Whereas the proportion of college graduates in today’s 25- to 44-year-old population universally exceeds that of older generations, some states in the Deep South, Southwest, and parts of the Great Plains and Inter-mountain West will apparently continue to lag, for decades, somewhat behind today’s U.S. average.
Neither the urban transition’s slow-but-steady advance, nor its link to prosperity are wholly certain. Each time that America’s cities have lost their historic link to prosperity, the urban transition has stagnated and, in some states, momentarily retreated. In the late 1970s and ‘80s, Rust Belt cities began to experience massive industrial plant closures, leading to the demise of union political power, dramatic job losses, and population decline. Together, these infused the region with a surprisingly persistent “reddish tinge.”
Given the current alignment of America’s two major political parties, and the education and urban transitions’ characteristically slow rates of change, U.S. presidential elections—when viewed through the lens of the two-transition model—seem destined to remain close and contentious for at least another decade. Nonetheless, if these coupled transitions steadfastly remain the strongest basis of political differences among states, it is not hard to imagine an eventful shift, by the 2030s, in the presidential election map’s now-familiar pattern.
Editor’s Note: This article has been updated with a new Figure 2, which replaces the original Figure 2 that showed in two bar graphs presidential election results in states with (a.) above-average and (b.) below-average urban proportions, grouped by the state’s proportion of college graduates.
Richard Cincotta is a Global Fellow with the Wilson Center’s Environment and Security Program, and a senior fellow at the Population Institute
Sources: Associated Press, CNN, Pew Research Center, U.S. Census Bureau, 538.com
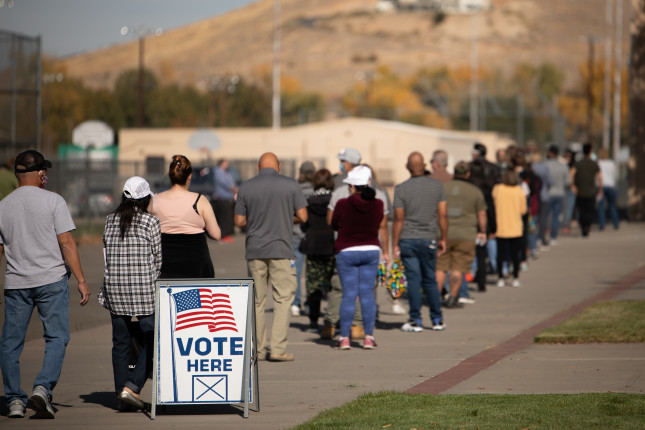
Photo Credit: Voters in Sparks, Nevada go to the polls on Election Day (November 4th) 2020, courtesy of Trevor Bexon/Shutterstock.com.
 A Publication of the Stimson Center.


