-
Climate Data Can be Critical in Fragile and Conflict-Affected States – Here’s How to Get It
October 5, 2015 By Schuyler Null
When war breaks out, what happens to the weather forecast? Violent conflict disrupts many essential services in developing countries and one of the most overlooked is meteorology, which has surprisingly big consequences for farmers, policymakers, and the aid workers who are there to help.
Without a functioning weather system, it’s significantly harder to prepare for changes of all kinds. Aid and other investments in fragile states can be wasted if decisions are based on faulty assumptions about current or future conditions. But a report from the Canadian think tank International Institute for Sustainable Development (IISD) offers some guidance to peacebuilding practitioners, pointing out that more climate information is freely available today than ever before.
“A Significant Challenge”
“Climate change poses a significant challenge to the transition of fragile states toward peace and stability,” write IISD authors Simon Mason, Andrew Kruczkiewicz, Pietro Ceccato, and Alec Crawford.
Cruelly, many of the poorest and most conflict-affected countries are facing the worst effects of climate change, thanks to a confluence of natural and human geography. In sub-Saharan Africa, the Middle East, and South Asia, changes in rainfall, temperature, and frequency of extreme weather events are projected to be most damaging and the majority of the affected population relies on rain-fed agriculture (while contributing the least to greenhouse gas emissions). These stressors can exacerbate or prolong conflict, and violence in turn can further increase people’s vulnerability to environmental change.
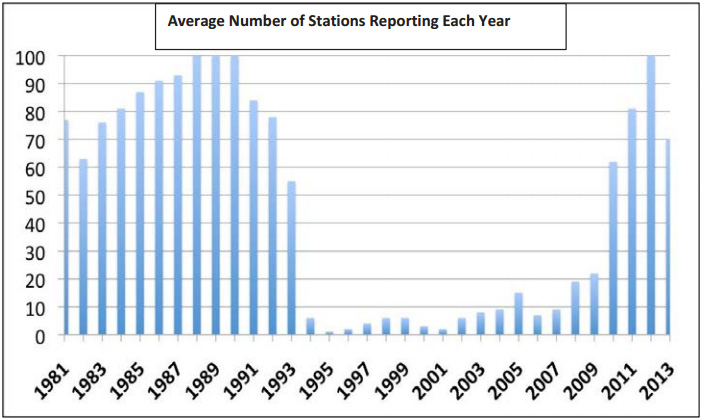
A healthy weather service is fed real-time data by numerous stations and rainfall gauges spread across a territory. This data is collected by a central meteorological service to provide context for current conditions, create forecasts, and issue warnings. Collecting climate data allows you to see trends and predict poor conditions, but during conflicts or periods of instability this infrastructure is often disrupted.
In Rwanda, for example, the number of reporting rain gauges fell from between 50 and 100 to essentially zero after the 1994 genocide. This disruption lasted more than decade. When the Taliban took over Afghanistan, they banned weather forecasting, which they considered a “form of sorcery,” destroyed the offices of the Afghan Meteorological Authority, burned the historical climate archives, and fired 600 meteorologists, according to Mason et al.
The absence of a functioning weather service creates a major hole in short- and long-term planning. In all of South Sudan, there are only four reporting weather stations, or about .07 per 10,000 square kilometers of land. Compare that to more six stations per 10,000 square kilometers in Germany. Pakistan, afflicted by “historic” flooding in four of the last five years and a deadly heatwave this year, has just .45 functioning weather stations per 10,000 square kilometers of territory.
Open Data Sources
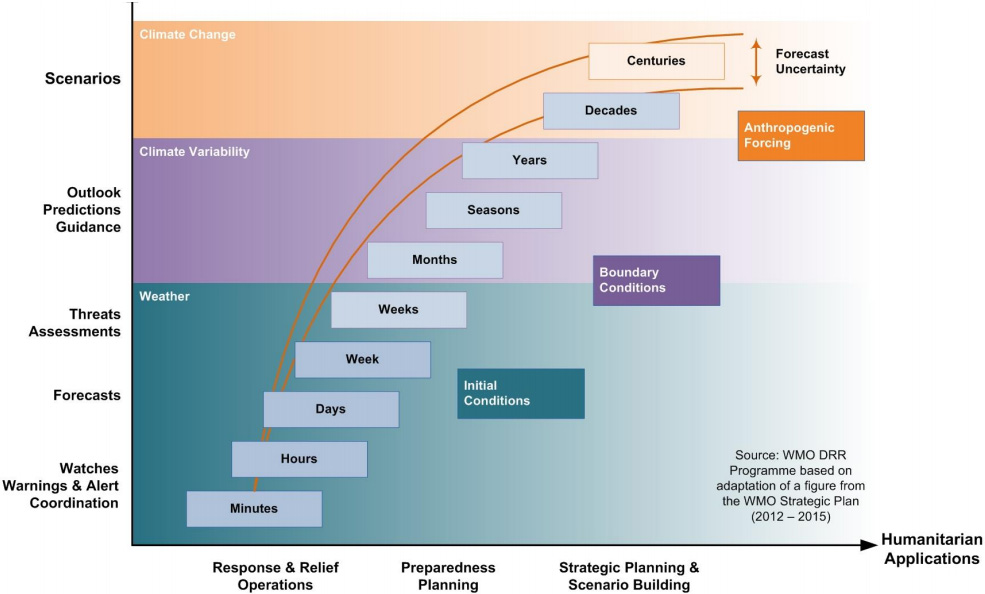
The good news is that more data is available from open sources than ever before. Though not a complete replacement for the granularity offered by a robust national weather services, many meteorological centers collect global and regional data for temperatures, rainfall, and vegetation coverage using satellites.
The World Meteorological Organization, a United Nations agency, is working to establish a universal climate forecasting framework for these sources of data. The aim is to encourage sharing between meteorological services and establish a stronger consensus, but a side effect is more openly available data.
The report notes that many climate centers are already sharing vast amounts of information online. Columbia University’s International Research Institute for Climate and Society maintains a huge data set, including indexed information from the Global Telecommunications System and NASA’s MODIS and NOAA’s AVHRR satellites. Links to online databases from NASA and NOAA themselves are also provided (see Annex 1). Among the climate data sources highlighted, Africa appears to have the most coverage.
Mason et al. urge peacebuilding practitioners in fragile and conflict-affected states to incorporate these sources of data into their work. Short-term alerts and forecasts are very useful and can be produced fairly easily. Medium-term seasonal outlooks can help aid workers find locations for camps for displaced people that are not vulnerable to climate-related problems (e.g., flooding). Even longer term historical trends can inform decisions about resource-based livelihood interventions and infrastructure investments. For example, if an area is expected to become hotter and drier, it would be wise to plant drought-resistant crops.
In one case, the International Research Institute for Climate and Society developed a map for Eritrea that illustrated the relationship between climate changes and incidences of malaria and helped identify existing vulnerabilities and anticipate future outbreaks.
The report does urge caution, however, noting that the data available sometimes requires expertise to interpret correctly. “There are no simple rules to facilitate the proper interpretation of the climate data,” they write. “Practitioners are advised to work with climate experts when possible.”
This can be a challenge given the lack of expertise available in fragile and conflict-affected states – not to mention the competition for head space among humanitarian and aid workers themselves, who are often being pulled in many different directions. In addition, access to the internet can be intermittent or nonexistent.
But in those places where it is possible, the effort may be worth it. Where climate vulnerability and state instability converge, open climate data can be a powerful tool to inform decisions about access to, control of, and use of natural resources that puts peacebuilding efforts on the right track.
Sources: International Institute for Sustainable Development, International Research Institute for Climate and Society, Notre Dame Global Adaptation Index.
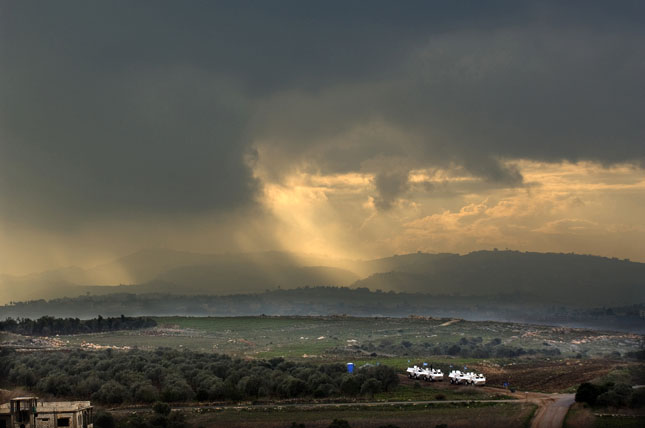
Photo Credit: A storm moves over UN peacekeeping forces in Lebanon, January 2011, courtesy of Pasqual Gorriz/UN Photo. Figures: IISD.
 A Publication of the Stimson Center.


