-
Climate Change in a Growing, Urbanizing World: Understanding the Demography of Adaptation (Book Launch)
November 7, 2013 By Jacob Glass
The effects of climate change are often conveyed through the lens of changing physical landscapes. Shifting weather patterns, the intensification of drought, flooding, and coastal erosion are all primary areas of climate research. But do researchers know enough about changes in the size, distribution, and composition of human populations as they relate to climate vulnerability? [Video Below]
No, according to The Demography of Adaptation to Climate Change, a new book co-produced by the United Nations Population Fund, International Institute for Environment and Development, and El Colegio de Mexico .
“This book addresses a gap in our adaptation efforts to date by pointing to the vital role that an understanding of population dynamics and the use of demographic data can have in developing proactive and effective adaptation policies and practices,” said Kathleen Mogelgaard, an ECSP consulting expert on population and climate, at the Wilson Center on October 2.
Mogelgaard and three of the book’s contributors discussed avoiding static perceptions of human vulnerability to climate change and how to use population and survey data to better inform adaptation efforts.
“Who, Not What”
“The discussion around adaptation…continues to be oriented to ‘what’ rather than ‘who,’ to the physical environment and vulnerability and impacts therein, without always the recognition that the end we are trying to achieve is resilience, security, and well-being for people,” said Daniel Schensul, a technical specialist at the United Nations Population Fund. “The population perspective can really bring that.”
“How the world adds 2.5 billion new urban residents in the coming decades is going to shape enormously the livelihoods, the wellbeing, and the environmental security of those urban residents, and our societies, and our economies overall,” he said.
As some of the fastest growing cities are located on coastlines, this incredible rate of urbanization moves people towards areas of vulnerability, rather than away. And rather than some future movement of people fleeing environmental disasters, he noted these urbanization trends are happening already. “It’s not about your environmental threats 10, 20, 30 years down the line, it’s about your job and your wellbeing and your social networks and your family,” Schensul said.
Jon Barnett on why climate adaptation is more than building infrastructure But in order to understand patterns of urbanization and human migration, Schensul said researchers need access to better aggregated socioeconomic and housing data. Climate vulnerability depends on an individual or household’s ability to prepare and respond to crises, said Schensul. For example, the ramifications of a flood will be profoundly different for a family with the means to leave an at-risk area, compared to a family without that option. “The way a climate hazard impacts a society is highly differential…what you bring to the table really shapes the way you can respond to environmental disasters that may occur,” he said.
Through the analysis of both large-scale trends (such as human migration) and household-level data (such as economic capacity), a more complete understanding of climate resilience and vulnerability can be achieved. “To put it very simply, knowing the size density, composition, and characteristics of the people in exposed areas is critical for finding ways to help them adapt,” Schensul said.
Open Up Access to Existing Data
Much of the information needed is already available, said José Miguel Guzmán, regional coordinator of demographic and health surveys at ICF International, a consulting firm that, among other things, works with public and private organizations to plan for environmental change. Extensive census and survey data for many regions is there to be had, but climate researchers don’t or can’t take advantage of it. For example, he noted that the UN’s 2010 World Population and Housing Census, which covered more than 90 percent of the world’s population, provides information on household capacities such as construction materials and the availability of temperature control, but has been largely ignored by the climate field.
Rather than invest in new large-scale data collection programs, Guzmán said existing data sets can be adapted to give analysts the information they need to assess a population’s resilience and vulnerability to climate shocks. The challenge, he said, is opening up access.
Because census and survey data is primarily collected by individual countries, information is often kept confidential and not made available to foreign researchers. Further, the sheer quantity of information being collected from different sources makes analysis cumbersome without proper standardization – especially for researchers from another field. “There is so much data available that just a compilation of indicators on everything in existence in a central database is not very useful,” he said.
Guzmán suggested that action be taken to increase access to national censuses and surveys and implement cross-country trainings to facilitate knowledge transfer and establish standard data collection methods. “What we propose here is the need to create, reprocess, [and] rearrange existing individual and household data to map and analyze the vulnerabilities and adaptive capacities to climate change impacts,” he said.
Geocoding Vulnerability
Once data is available, geographic information systems (GIS) can be a powerful tool to link different indicators in multi-level, customizable maps that policymakers understand, said United Nations Population Fund consultant Sainan Zhang.
As part of her interactive presentation, Zhang showed how indicators as diverse as “the percentage of people that are involved with agriculture, whether a household has a grass roof, and whether a household has a radio to get information” can be combined to show different levels of vulnerability in Malawi.
GIS technology can also be used to model climate scenarios, and combined with thorough household-level indicators, create very detailed maps of vulnerability. “For each risk level we can have a closer look at their population structure and housing conditions, and in this way we can know where the high risk areas are and who lives there,” Zhang said.
Population Data Helps Connect the Dots
Watching the event from the Society of Environmental Journalists Conference in Chattanooga, Tennessee, several journalists asked the panelists their advice on how best to report such a complex story of climate change, urbanization, and vulnerability/resilience.
Schensul urged them to “pay attention to the secondary and tertiary cities,” pointing out that nearly 1.9 billion people live in cities smaller than 500,000 residents. “The majority of the population in coming decades will continue to live in cities under a million people, and these cities are precisely those that don’t necessarily have the enormous resources, the capacity, and the ability to engage with international partners to conduct international adaptation activities.”
“There is no doubt that census and household survey data are excellence sources of good and quality data for climate change adaptation,” said Guzmán. “This is an important area of research and practical work that can help to connect the dots between individual and community adaptation, between demography and geography, and between environment and population dynamics.”
By providing a framework linking demography and adaptation, The Demography of Adaptation to Climate Change attempts to close a major gap in climate research and provide the foundations for continued research.
“We all understand the complexities of communication around climate change, and this work we hope will contribute, by making data accessible and by making population change understandable,” said Schensul.
Event Resources:
- José Miguel Guzmán’s Presentation
- Daniel Schensul’s Presentation
- Sainan Zhang’s Presentation
- Photo Gallery
- Video
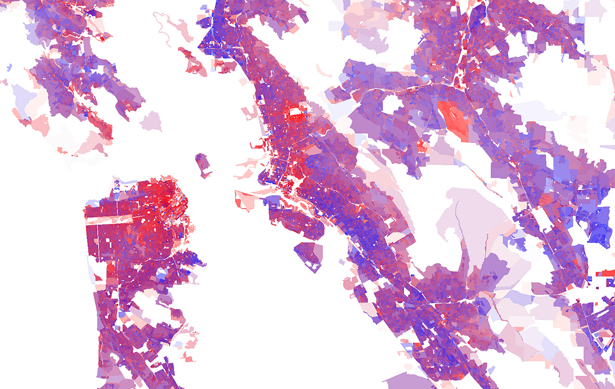
Image Credit: 2010 U.S. census data on density of adults (red) and children (blue) in the Bay Area, courtesy of flickr user Eric Fischer.
 A Publication of the Stimson Center.


