-
The Land Matrix Visualizes Ebbs and Flows of Global “Land Grabs”
December 4, 2012 By Carolyn LamereOver the past few years, large-scale acquisition of land by foreign or domestic firms, be they public or private, have been making headlines. But although these “land grabs” have received a great deal of attention, their details remain largely unknown. Which countries are the primary investors? Which are the main targets? What is the land used for?
A new online public database, the Land Matrix, looks to answer these by serving as an open-source clearinghouse for information and visualizing the results in informative (and gorgeous) graphics. Funded by a number of international organizations including the International Land Coalition, the Centre for International Cooperation in Agronomic Research for Development, and the Centre for Development and Environment, the database provides a comprehensive and dynamic view of the state of land acquisition.
The Matrix
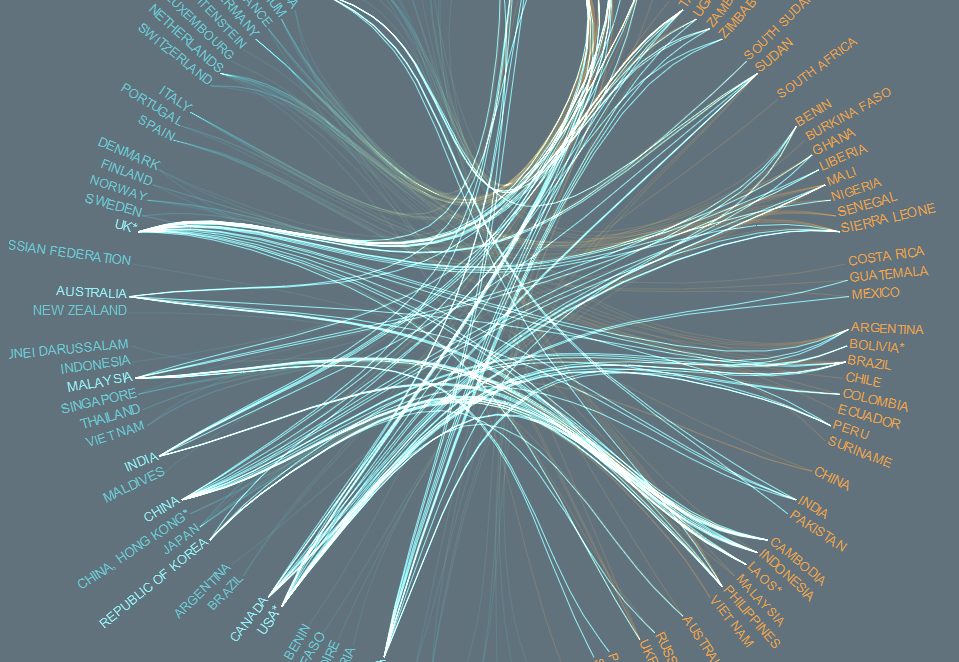
Users can explore the connections between investors and investees in a variety of ways.
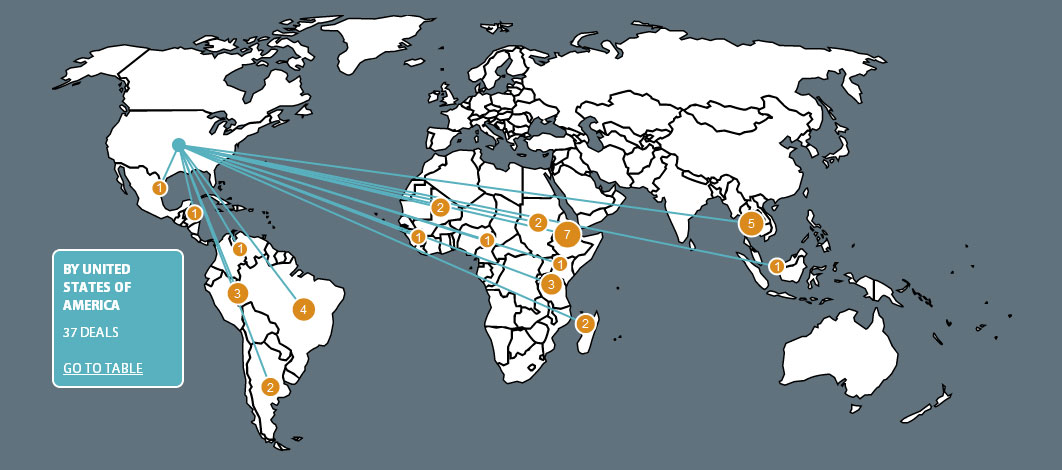
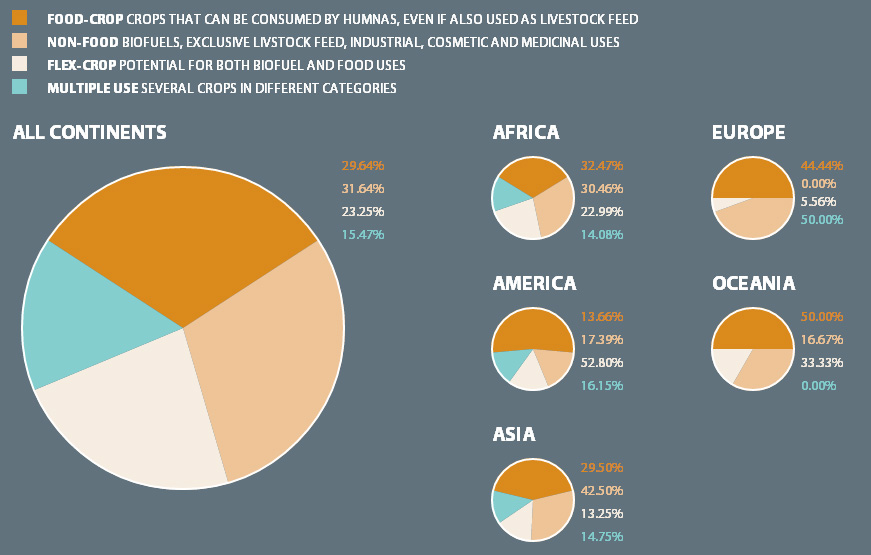
The matrix is presented in three main pages: an interactive web showing the various deals connecting countries around the world and two maps showing investor and target countries and a summary of land deals by region. There are also infographics illustrating the top 10 target countries, the countries where the most and least amount of data is available, and the total ratio of crop breakdowns by continent. All of these are updated as more information is added to the database.
The different tools help tease out different kinds of information, while the interactive format keeps you from being overwhelmed by numbers. For example, the maps show that of the 121 land acquisitions accounted for in India (at press time), 95 are by domestic companies, and most of India’s international acquisitions are located in East Africa.
Other data provides insight into the drivers behind land acquisition. While most land is used for agriculture, the investment by sector page shows that not all the deals are related to food. Some crops, like jatropha, are used primarily to produce biofuels; rubber is another commonly produced non-food crop. Others, like corn, sugarcane, and soy, can be used either for food or biofuels which makes delineating the drivers of land acquisition difficult.
From most to least, forestry, industry, mining, livestock, tourism, renewable energy, and conservation also account for a small portion of deals.
“Un-Transparent” By Nature
The Land Matrix does offer caution regarding the reliability of its data for several reasons.
 First, since land deals are “un-transparent” by nature, any index will be incomplete and may contain errors. It also notes that some countries may be overrepresented. Peru’s open data policy may make it appear to have proportionally more deals than other countries in the region, for example. Similarly, interest in Africa may mean that deals in African target countries are documented more frequently than those in other regions.
Second, because of its open source nature, not all of the data is from verifiable sources, and the website is still undergoing updates and upgrades (it’s still in beta, as the header says).
For those interested in greater detail regarding the causes and consequences of these land deals, the Land Matrix Partnership provides a synthesis of the results of the database and other key research, by Ward Anseeuw, Mathieu Boche, Thomas Breu, Markus Giger, Jann Lay, Peter Messerli, and Kerstin Nolte. (And of course, there’s also The Global Farms Race, from the Wilson Center’s own Michael Kugelman and Susan Levenstein.)
Though the Land Matrix provides an extensive amount of data, it is far from a comprehensive look at global land grabs. Nor is it intended to be; it is a “tool that facilitates an on-going discussion,” as the website puts it. But the matrix could play a valuable role in illustrating the flows of money and produce in a complex and murky set of relationships.
Sources: Al Jazeera, The Guardian, Land Portal.
Image Credit: TheLand Matrix.
 A Publication of the Stimson Center.


