-
Who Are the Most Vulnerable to Ocean Acidification and Warming?
October 17, 2012 By Carolyn LamereIn 2011, a record 34 billion cubic tons of carbon dioxide were emitted from man-made sources. Half the emitted CO2 stays in the atmosphere, about a quarter is absorbed on land (as trees grow, for example), and the remainder is absorbed by the ocean. Unsurprisingly, this incredible amount of carbon dioxide significantly changes the ocean environment. Over time, increased absorption of carbon dioxide in the oceans has led to ocean acidification, and overall warming has also led to warming of ocean waters – both changes impact marine ecosystems and the people who rely on them.
Many studies have been conducted on acidification and warmer waters, like its association with smaller fish size, for instance. But a new study by Matthew Huelsenbeck for the advocacy group Oceana is one of the first that tries to index exactly which countries are most vulnerable to these changes. It provides a good overview of how ocean changes might affect people, but lack of detail on the data used to compile the index and specificity about why particular countries are ranked where they are limits its usefulness.
Acidification and Warmer Temperatures
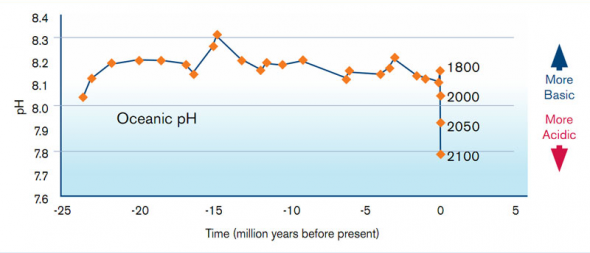
Ocean acidification has a serious and significant effect on the ability of certain organisms to calcify their shells. Coral reefs and mollusks, like mussels and oysters, are especially at risk, and their vulnerability could have a particularly great impact on the people who depend on fish and seafood. Huelsenbeck notes that the ocean’s pH has dropped by 30 percent since the beginning of the Industrial Revolution, a change which represents a formidable threat to oceanic food supply.
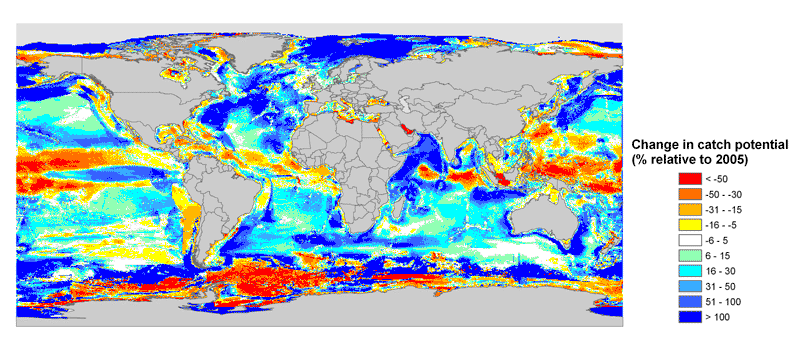
Warming temperatures also have an impact on fish and seafood. As oceanic temperatures increase, marine animals migrate out of the tropics and toward the poles and deeper waters. Fishing yields in tropical countries are projected to decline by up to 40 percent as a result of warmer temperatures, according to Huelsenbeck. Developing countries are especially vulnerable, he remarks, because they lack the capacity to send their fishing fleets to cooler regions.
To determine how significantly a country will be affected by the rising temperatures and changing conditions of the oceans, Huelsenbeck takes into account factors encompassing exposure (e.g., predicted change in catch potential by 2055) and degree of dependence on ocean resources (e.g., the percentage of the average diet in a country provided by fish and seafood).
Geography, Demographics, Wealth, and Vulnerability
While some countries will be able to respond to the changing oceanic conditions – replacing fish and seafood with other types of protein, for example – other states will find it more difficult to adapt. Huelsenbeck uses GDP per capita, population growth, and percentage of the population currently undernourished to measure a country’s potential to adapt to changing circumstances.
Unsurprisingly, many top-ranked countries are small, tropical island states, where fishing yields are projected to decrease the most and there are few opportunities to adopt other livelihoods if changing conditions make seafood less available.
Almost half of the top twenty states have a total fertility rate (TFR) greater than four children per woman, according to the UN Population Projections. As populations grow rapidly in these countries and seafood becomes more difficult to access, more people will have to subsist on less locally-available food.
A number of these states already have low food security. “In some nations, like Comoros, more than 50 percent of the population is undernourished, representing hundreds of thousands of hungry individuals,” Huelsenbeck notes.
The Devil in the Details
While the report synthesizes a great deal of information about oceanic changes and country vulnerability, it does not provide a comprehensive breakdown of methodology and data.
The inclusion of some countries is puzzling. Croatia, for example, is listed at number 16, but was number 89 in a previous Oceana report which just ranked vulnerability to ocean acidification. It also has very low fertility (1.42 children per woman) and had a per capita GDP of $14,480 in 2011, almost twice that of the next richest country in the top 20. The presumed impact of warming therefore must be very significant, but there’s no way to tell because there’s no country breakdown.
Other countries, like China and the United Arab Emirates (numbers 35 and 44, respectively), seem likely to be able to purchase other sources of protein or form long-range fishing fleets. Huelsenbeck was nice to enough to respond to some of these criticisms in an email:
Some of the countries you mentioned may have the capacity to adapt their national food security strategy from international trade agreements, more imports and otherwise, but they are at risk of losing ocean-based food under the models used. Any substitutions will replace a public resource with private resources, and fish is often the cheapest and healthiest protein for poorer fishing communities.
Huelsenbeck also clarified that the “weighting was equal between exposure, dependence, and adaptive capacity,” and exposure at least was based on modeling by William Cheung et al. in 2009, but we need more of that detail. While the report is a good starting point, opening up the methodology and going into more detail on the particular factors contributing to rankings seems like a necessary and logical next step.
Perhaps most importantly though, aside from questions about data, the report is a reminder that changes to marine ecosystems affect more than just biodiversity or species health, but also have a huge impact on human food security, livelihoods, and even state stability. The most vulnerable states in the index are threatened by more than just carbon emissions and rising temperatures, and more than fossil fuels need to be addressed to improve their stability and security.
Sources: CNN, CO2Now, Fund for Peace, Nature, Oceana, PBL Netherlands Environmental Assessment Agency, Secretariat of the Pacific Community, UN Population Division, World Bank.
Image credit: Oceana; map credit: Carolyn Lamere/Google Maps.
 A Publication of the Stimson Center.


