-
Ecological Footprint Accounting: Measuring Environmental Supply and Demand
September 12, 2012 By Kate Diamond
Twenty-five years have passed since the Brundtland Commission first brought sustainable development to international prominence. Today, the United Nations appears on track to replace the soon-to-expire Millennium Development Goals with “Sustainable Development Goals,” marking the extent to which the international community has embraced the concept. And yet, in spite of its prominence, a specific and measureable definition of sustainability remains lacking.
Part of the challenge is measuring carrying capacity, and advocacy group Global Footprint Network offers one model – “ecological footprint” – as a way forward. The model, discussed in depth in the network’s Ecological Footprint Atlas, combines data from the United Nations and other international sources, covering 240 countries, territories, and regions dating back to 1961, to create estimates of ecological supply (“biocapacity”) and demand for six general types of land use: fishing grounds, cropland, grazing land, forest, built-up land, and carbon footprints (a stand-in for the amount of forestland needed to absorb carbon emissions).
Ecological Footprint Accounting
Based on doctoral research by Global Footprint Network co-founder Mathis Wackernagel, the goal of the ecological footprint model is to bring sustainable development “from concept to action.”
According to the network, it took the Earth a year and a half to generate all the resources used in 2007 (the most recent data available). Global biocapacity – which is regenerative to a certain extent – was 1.8 global hectares per capita; that is, the world’s natural resources, producing at an average global yield (hence “global” hectares), split evenly amongst everyone, could sustainably provide 1.8 hectares to each person. Average global demand, however, was 2.7 global hectares per person, outpacing demand by 52 percent.
As people use the world’s resources faster than they can regenerate, we enter “ecological overshoot.” Persistent overshoot – as aquifers dry up, fish stocks gradually disappear, and we continue to emit more carbon dioxide than natural sinks can absorb – makes the “shortage or even collapse of critical ecosystems” likely, possibly leading to an era not just of “peak oil” or “peak water,” but “peak everything,” Global Footprint argues.
Alongside more concrete measurements like fish stocks, soil quality, forestland, and arable land, there are less easy-to-understand metrics too, like “carbon footprint” which, they write, is a significant driver of overshoot. Pulling together data from UN trade statistics, the International Energy Administration, the U.S. Department of Energy, and the International Panel for Climate Change, footprint accounts sum together emissions from burning fossil fuels, changes in land use (like deforestation), and international travel (for both people and cargo) to determine the amount of anthropogenic emissions in the atmosphere. Taking into account the amount of carbon sequestered naturally in oceans, the authors then assess how much forestland would be needed to absorb the remaining carbon dioxide emissions.
Importantly, the authors acknowledge shortcomings with their calculations, and specifically identify carbon capture and sequestration as something “the footprint does not measure well” (as an example, carbon dioxide is just one of several greenhouse gases impacting the environment, yet it is the only greenhouse gas incorporated into their sequestration calculations).
The Burden on the World’s Poorest
Under this overshoot model, dwindling natural resources “will play a crucial role in the success or failure to reduce poverty, hunger, and disease,” write the authors, and mismatches between the haves and the have-nots will have important geopolitical implications. Given these stakes, low-income countries, many of which are nonetheless rich in natural resources, would seem to be poised for success, “yet their populations often suffer first and most tragically when humanity’s demand on the biosphere exceeds what the biosphere can renewably provide.”
For instance, rising levels of consumption – or disruption of existing supplies – elsewhere can prompt large-scale land acquisitions in developing countries to secure cheap access to arable farmland, water, or other natural resources. And rising energy and food prices, driven in part by anthropogenic climate change, also have a disproportional impact on families in developing countries, where food purchases account for as much as 70 percent of household income.
John Williams on helping people while preserving biodiversity hotspots Low-income countries also tend to have faster-than-average population growth, which, as a general trend, “plays a disproportionally large role in humanity’s total ecological footprint.” While the atlas acknowledges that population growth is taking place more rapidly in lower-income countries than anywhere else, it does little to explore why that is so, how it might be addressed, or the complex implications that uneven growth between (and within) countries can have for sustainable development. For example, within developing countries, population growth tends to be highest (and poverty most widespread) around biodiversity hotspots. This combination leaves hotspot communities dependent on the surrounding resources for subsistence, even as the preservation of those resources becomes more crucial to maintaining biocapacity on a global scale.
Implementing the Model
The idea of the ecological footprint is catching on: Global Footprint Network reports that 200 cities, 23 countries, and 47 international, regional, and local non-governmental organizations already incorporate it into their environmental planning in some fashion.
WWF International works hand-in-hand with the Global Footprint Network in producing its annual Living Planet report and is using footprint accounting as the basis of an advocacy campaign to eliminate overshoot by 2050.
Likewise, Global Footprint says that the Philippines is “exploring ways to incorporate” into its national land use plan; Indonesia is already in the early stages of doing so, conducting an initial audit of its footprint in 2010; and cities like London, San Francisco, and Quito have used the model in establishing priorities for their infrastructure, energy, and development plans.
Changes on the city level will be particularly crucial to ending the era of overshoot and laying the groundwork for a more sustainable future, according to Global Footprint.
More people live in cities today than do not. China alone has 94 cities of more than one million, and by 2025, is expected to have 163. Following these trends, cities hold unique potential to reverse overshoot as urban planners lay down infrastructure that will help form the consumption habits of generations to come.
Better resource management, based on a better understanding of where, how, and how much people use natural resources, will be key to making full use of that potential. As the authors write in the 2010 atlas, “we cannot make meaningful decisions about where we need to go before we know where we stand.”
While Global Footprint offers an interesting framework for tracking natural resources – doubtless an essential part of staying within carrying capacity and ensuring sustainable development – they fall short on some of the more complicated reasons for why sustainable development has thus far been so difficult to achieve. As they acknowledge, much more work must be done to understand how to measure and track the greenhouse gas emissions that alter the environment, but also overlooked is how much more work must be done to understand the complex interaction of these trends with population dynamics. The difference between the UN’s low and high variant projections for mid-century global population is 2.5 billion – a significant number for any calculation of carrying capacity.
For sustainable development to move from concept to reality, these issues will have to be addressed in a comprehensive manner that not only recognizes their complexity, but explores opportunities that arise from their interconnectedness as well.
Sources: Food and Agriculture Organization, Global Footprint Network, United Nations Population Fund.
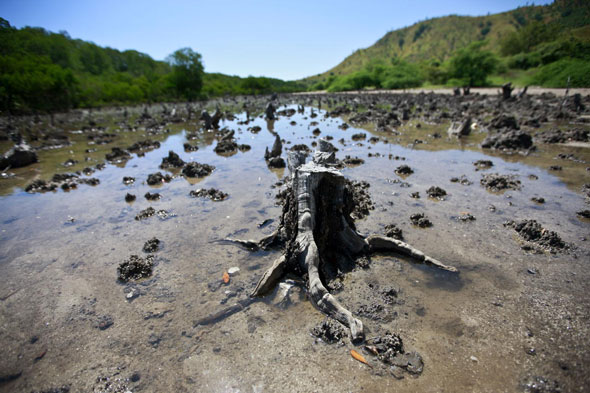
Photo Credit: “Mangroves Cut in Hera, Timor-Leste,” courtesy of United Nations Photo.
 A Publication of the Stimson Center.


