-
The Economist
In Poor Countries, Is Lower Fertility Bad for Equality?
August 23, 2012 By Wilson Center StaffThe original version of this article appeared on The Economist.
Economies benefit when people start having smaller families. As fertility falls, the share of working-age adults in the population creeps up, laying the foundation for the so-called “demographic dividend.” With fewer children, parents invest more in each child’s education, increasing human capital. People tend to save more for their retirement, so more money is available for investment. And women take paid jobs, boosting the size of the workforce. All this is good for economic growth and household income. A recent National Bureau of Economic Research study estimated that a decrease of Nigeria’s fertility rate by one child per woman would boost GDP per head by 13 percent over 20 years. But not every consequence of lower fertility is peachy. A new study by researchers at the Harvard School of Public Health identifies another and surprising effect: higher inequality in the short term.
Countries with very high fertility are usually dirt-poor – peasants value extra hands, however small, to help in the fields. (In Niger, which has a GDP per person of $700, the average woman can expect to bear more than seven children.) Low-fertility countries (with significant exceptions, such as China) tend to be rich. The Harvard study confirms that this pattern is replicated within countries: as a rule, the poor tend to have larger families. The authors use Demographic and Health Surveys (DHS), which contain a lot of detail about family structure and household assets. DHS data from 60 developing countries enable them to divide households into five income groups and to show that in every continent, the “youth-dependency ratio” (the number of children under 15 compared with the working-age population) is lowest in the richest group, next lowest in the next-richest group and so on. The poorest group has the highest youth-dependency ratio. The gap between top and bottom is marked. Ratios in the richest households are a third below those in the poorest ones.
Continue reading on The Economist.
Sources: Harvard Initiative for Global Health, National Bureau of Economic Research.
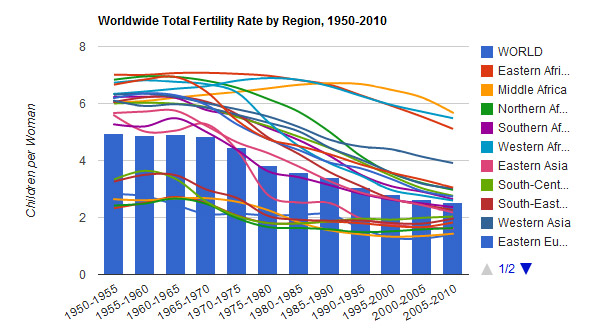
Chart Credit: Data from the UN Population Division, arranged by Schuyler Null.
 A Publication of the Stimson Center.


