World population is growing – earlier this week, the global community symbolically marked the arrival of the
seven billionth person. But the unprecedented growth in global population over the last few decades has not affected everyone equally – in 1950, 68 percent of the world’s population lived in developing regions; today that number is
82 percent.
MEASURE’s latest version of their
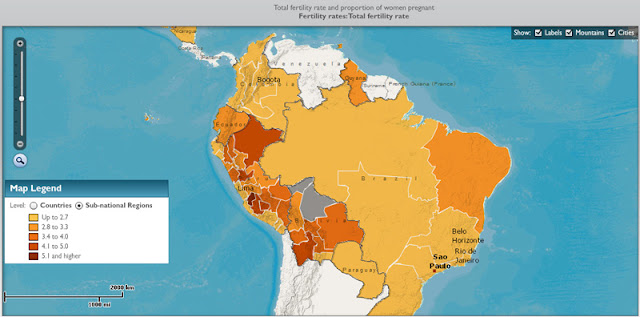
STATcompiler tool helps visually highlight areas simultaneously experiencing the most demographic change and poor health indicators.
The revised STATcompiler – released in September – provides new ways for users to visualize data by generating custom data tables, line graphs, column charts, maps, and scatter plots based on demographic and health indicators for more than 70 countries. Users can select countries or regions of interest, and relevant indicators, including for family planning, fertility, infant mortality, and nutrition. Tables can be further customized to view indicators over time, across countries, and by background characteristics, such as rural or urban residence, household wealth, or education. In some cases, sub-national data is available. User-created tables and images are then exportable so that they may be easily used in papers or presentations.
Since STATcompiler is still in active development, certain functions are still being added. HIV data has not yet been integrated into the program, nor has the express viewer function, with customizable, ready-made tables for quick access. Additionally, updated information is not available for all countries, in all categories – for instance, the most recent data available for Mexico comes from a 1987 survey. If preferred, the legacy version remains available to users in the meantime.
MEASURE DHS – the Monitoring and Evaluation to Assess and Use Results Demographic and Health Surveys project – provides technical assistance for data collection on health and population trends in developing countries. Their demographic and health surveys, funded by USAID, provide data for a wide range of monitoring and impact evaluation indicators at the household level in the areas of population, health, and nutrition. They have become a staple data source for researchers, and the addition of better analysis functions and dissemination tools, via STATcompiler, will hopefully help advance understanding of demographic and health trends.
Image Credit: Map from STATcompiler, arranged by Schuyler Null.
 A Publication of the Stimson Center.


