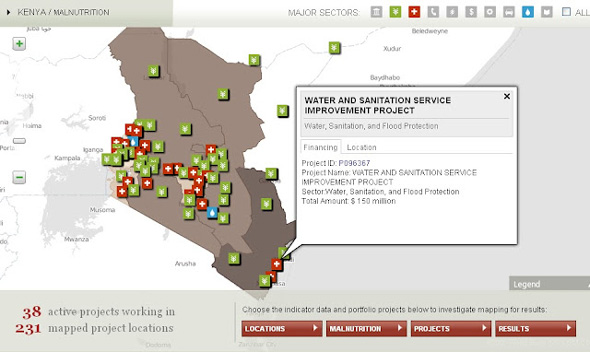
The World Bank recently released their interactive “
Mapping for Results Platform” that allows users to see where and how World Bank funding is being spent. Users can view project costs and expenditures by sector at sub-national levels and overlay this with human development data such as poverty, population, and health indicators. In the current beta version, interactive maps and downloadable data are available for Kenya, Bolivia, and the Philippines.
The example map shown above shows all of the World Bank’s 38 active water and sanitation, health, and agricultural projects in Kenya, as well as malnutrition rates by district. Clicking on any of the projects on the map displays the project name, financing amount, and exact location of the program.
Presumably, in the final version, all 2,669 active World Bank projects and 15,246 project locations – accounting for $136.91 billion – will be included.
Image Credit: World Bank Mapping for Results Platform.

 A Publication of the Stimson Center.


