To kick-off the New Year, we’re highlighting
CensusInfo 2010—an initiative to help countries distribute their census data in a format that is free, flexible, and customizable to meet diverse public needs. For us, it’s a new tool to access and visualize
census data from around the globe.
The
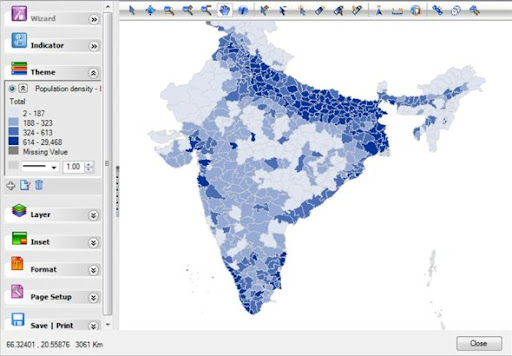
CensusInfo software(the program must be downloaded and installed) allows users to create tables, graphs, and color-coded maps depicting indicators such as population density, fertility rate, and sex ratio. The data’s resolution—national, regional, district, or smaller—is up to the user, but limited by the information reported by each country’s census bureau. When older data is available, users can also view trends over time.
The heart of CensusInfo is data presentation. Robust options include: capacity to import new datasets, compatibility with Google Earth and NASA’s World Wind technologies, and the ability to download visualizations as images, “animated flipbooks,” and videos.
Aside from the relatively steep learning curve to master each of its functions, the software is principally limited by the small number of countries in its database: only 10 countries are included in the software’s pre-installed dataset. That number, however, could increase in the near future.
In what CensusInfo 2010 hopes will be a trend, the Palestinian Central Bureau of Statistics, as of August 2009, became the first National Office of Statistics to independently incorporate its data into CensusInfo. While a powerful piece of software, CensusInfo’s potential rests on whether others follow suit.
Photo Credit: CensusInfo’s output of population density in India.

 A Publication of the Stimson Center.


